
This section contains a case file for my major unique decisions from the various companies. Does anything stand out to you?
NVIDIA
My mistake was similar to AMD, not taking the opportunity to purchase more shares during the dip but instead played safe. This was the time to be risky and buy more. Missed opportunity in late April 2025 and May 2025 like AMD. However, entry was at a fair and reasonable price.
(04/11/2025): Nvidia has went up 103% based on average purchase price. Analysis was correct but did not capitalize on such an international opportunity.
YZJ SHIPPING COMPANY: May 2025
The Trade: Chased a rising price in May 2025, bought at $128, then ghosted it on the way down.
The Lesson: FOMO is a terrible investment strategy. DCA is your emotional first-aid kit. Bought at a slightly more expensive price $128 due in that period of Apr while there were many opportunities of buying at <$120. A promising company due to many healthy ratios such as a D/E ratio of 21.7%. And when it went down after 128, I did not DCA in, just hoping it will go up. That’s why understanding company financial health ratios is important.
(04/11/2025): YZJ went up 53% from average purchase price. Many promising shipbuilding projects are under way especially with the green initiative. Ships need to return for testing and rebuilding to clear new carbon emission standards. Cashflow is excellent as they mainly comprise of Shipbuilding orders, maintenance and rental. It has a low debt to equity ratio alongside increasingly efficient current ratios.
Another way to identify a great value company is looking at the behavior of how the stock has performed through past financial crisis. Did it stay strong or did investors scrambles and share price crumble. Indication of strong loyal or easily shaken investors.

United Health:
The lesson: How to spot a diamond that won’t shatter under pressure. A liability riddle. When a financial crisis hits, does the stock hold the line like a stoic guard, or does it crumble like a cookie in milk?
Currently in Aug 2025, it has a D/E ratio of 0.74. Currently above the industry mean of 0.64. So why does a company mainly health insurance have so much liability? Hedge fund insurance. But it is good value as of now.
Short term reversal: It is the tendency for a stock’s price to do the opposite of what it just did over a very recent period (usually a week or a month).
In simple terms: What goes up sharply tends to dip slightly, and what goes down sharply tends to bounce slightly.
Think of it as the market’s version of a rubber band. If you stretch a rubber band and let go, it snaps back. Short-Term Reversal is the market’s “snap back” effect.
It taught me to look under the hood of the ratios before making any decisions
Silver ETF: IShares silver
On 27/09/2025, The Ghosted Golden Opportunity. Reflecting on mistakes made on Silver ETF: IShares silver, I did set a target range from Jul2025 to Aug2025 and it fell within range but did not DCA in. Missed out on reading the indicators for better entry. Why silver now? My analysis is that gold has become overvalued hitting its all-time high of 4300+ as of (17/10/2025) where else silver is not only more affordable, it has better indicators that support regular buying volume.
Lastly, it has real world industrial application. Such as solid-state batteries in EV cars to use even more silver in years to come. A recent decline in overall global production (around 800-830 million ounces annually in 2023-2024), facing challenges like lower ore grades and mine suspensions. Based on economics, demand would increase and therefore holding onto silver in this volatile economy is not a idea to be quickly dismissed. In relation to my strategies, silver is a commodity. A different asset class that does not move in line with the index. This is one of the pivoting tools I was referring to.
RSI indicator was below the 70-mark meaning it was not overbought and room for price to go up. On top of that it is a commodity which has proven to rise steadily during such times. The window of opportunity is marked by lines in green.
IMPT: during times of volatility, a safe commodity is a strong tool for risk management by diversification and a trend that does not nosedive like the market.
On the 22/12/2025, the Silver ETF has reached an all-time high of USD$61.00 Circling back to the outlook presented earlier, the analysis does agree with the movement of the price. However, it has risen aggressively and does not seem sustainable. From $43 in 31/10/2025 to $61 in 22/12/2025. A 41% increase.
Looking back from 20-01-2026, the share price was still in its growth spurt as it has hit a high of over $80.00 within the month of January 2026. A note to self would be that as a commodity rises steeply in price, it can no longer be classified as a safe asset due to the argument that there might be a correction around the corner as share prices do not rise linearly forever.
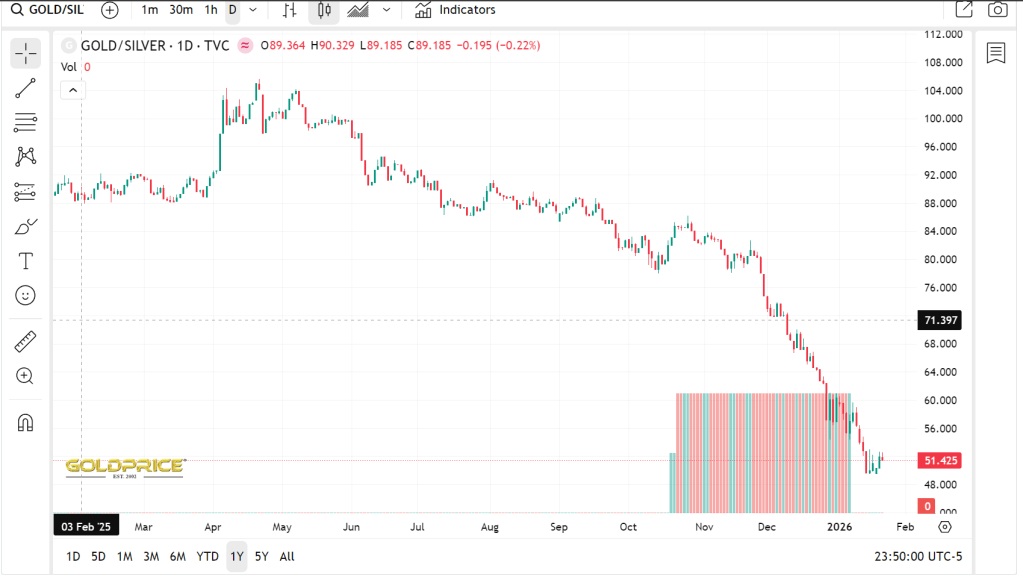
The gold to silver ratio (GSR) is currently at 50 (Per Oz of gold / Per Oz of silver). The lower the GSR gets, the riskier it is to hold silver. This is important as a gauge if Silver is cheap or expensive therefore when to exit. Why gold? : Relative values matter. Silver is already outperforming; volatility is increasing and therefore risk is no longer in our favor. So looking at the GSR chart, when the ratio drops quickly, silver often overshoots and underperforms gold in the following phase.
Salesforce:
On 9/10/2025, looking at salesforce being undervalued, technical indicators show the MACD was under and is seemingly about to overtake blue lining suggesting upward trend. Looking at RSI of 46, not super underbought but def not close to 70 as well.
For financial indicators, improving over the quarters such as debt to equity at 18%. A debt-to-asset ratio of 18% is considered excellent, indicating very low financial risk. Only 18% of a company’s total assets are financed by debt, with the remaining 82% funded by equity. A decision for purchase ROA and ROE increasing every quarter.
On 20-01-2025, the price of salesforce has been dropping. currently 6% below my average purchase price. The pain was definitely felt as the weightage is too high. A goal I have been actively pursuing which is to reduce the weightage not by selling off yet but by increasing the overall portfolio size. The gold to silver ratio (GSR) is currently at
(1/11/2025): Altria
Questions: “Man are people really getting healthier and abstaining from all these good stuffs”. It has hit a steep drop of 8+% in 2 days. Main reason being it missed profit earnings and investors are not forgiving to missing business goals. Current RSI is at 3 time periods are 7,17,29 respectively. All roads lead to underbought. MACD orange line is below the yellow line showing a decent sized sell volume.
Current decision is to buy but waiting for the MACD orange line to creep higher close to the blue line, waiting for the drop to bottom out. Current drop price is at 57-58.
🔮 Ready to see how I connect the dots?
“Every trade in this log is a puzzle piece. The Playbook is where I have a look at the big picture”. See the Strategies built from these lessons →
(Where individual transactions become macro strategies)
🔬This log is a perpetual work-in-progress. New cases (and new mistakes) are added regularly. All conclusions are subject to revision, usually right after the market proves me wrong again. 🔬
